
Transportation Planning for Health, Equity, and Climate Change
"The idea that we can cure ourselves and the planet by simply walking or riding a bicycle is both obvious and daunting given our current transportation system. ITHIM makes the case that active travel has a prominent role in solving the twin crises of chronic disease and climate change."
A Sample of ITHIM Results from Scientific Publications and Reports
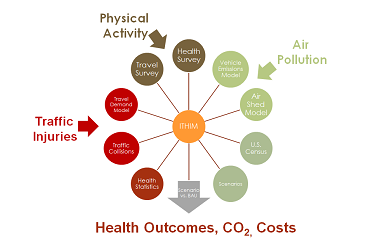 ITHIM models transportation-related physical activity, air pollution, and traffic injuries
 Many people in the United States are not physically active, and few get physical activity from active travel
 Active transport reduces chronic disease, but may increase injuries
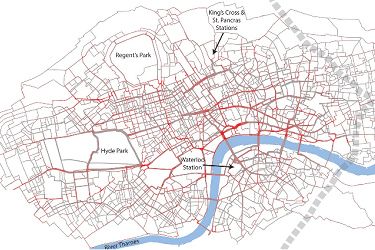 The evaluation of bike share programs and their health impacts is one of the uses of ITHIM
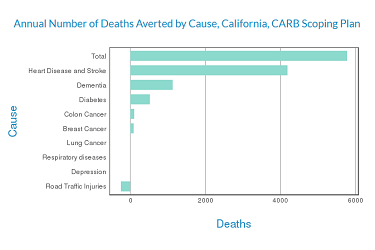 State agencies quantified the health impacts of their goals to reduce greenhouse gas emissions in transportation
 Local and state health departments assess the health impacts of their transportation plans using ITHIM
THIS WEBSITE IS SPONSORED BY


Introduction
What is ITHIM?
ITHIM stands for Integrated Transport and Health Impact Model (ITHIM). The U.S. version of ITHIM is a planning tool that answers the question of "How much benefit or harm to human health can we expect by changing the mix of active and motorized travel across the nation?"
ITHIM contrasts one travel pattern that serves as a reference with an alternative that has a different profile of fine particulate air pollution from vehicle exhaust, physical activity from walking and cycling, and injuries from traffic collisions. ITHIM calculates the change in deaths, years of life shortening and disability, and costs due to these changes in air pollution, physical activity, and traffic injuries.
How Has ITHIM been Used?
ITHIM has been used by governmental agencies and advocates to assess the health impacts of:
- Updates to regional transportation plans
- Goals of state and local health and transportation agencies
- City and regional transportation projects and programs such as high speed rail and bike-sharing.
The findings of several studies have been published in peer-reviewed scientific journals and have informed discussions of health, transportation policy, equity, and greenhouse gas mitigation strategies.1-5 ITHIM is currently being used across the United States by state and local health departments, state and regional transportation planning agencies, and academic researchers.
Why is ITHIM Important?
The transportation system impacts our health in both positive and negative ways.6 It enables us to access goods and services, jobs, educational opportunities, healthcare, recreation, and social networks. However, our current car-centric transportation system is also associated with long and sedentary commuting, noise, air pollution, urban sprawl, community severance, and traffic injuries. Yet, the transportation system can improve public health by offering opportunities for physical activity through walking and cycling --- "active travel". Cycling includes bicycles and other wheeled modes of travel propelled by our muscles. Because getting to and from transit involves walking and cycling, transit significantly contributes to active travel.7 Low levels of physical activity contribute to the premature deaths of over 220,000 Americans each year8 and raise the risks and costs of major chronic diseases.
In 2017, the transportation sector surpassed electric power generation as the leading source of greenhouse gas emissions in the United States. Transportation now accounts for 29% of annual emissions inventory.9 These gases lead to warming air temperatures, which favor the formation of smog. Smog (ground level ozone) harms health, particularly in vulnerable populations. Warming temperatures also contribute to sea level rise and wildfires, which endanger not only human health, but also transportation infrastructure. Replacing short trips taken by cars with walking, cycling, and transit represents a double win: improving health and reducing greenhouse gas emissions.
What is the History of ITHIM?
ITHIM USA is part of the ITHIM family of transportation and health models developed over the last decade. The first version was developed in 2009 by researchers at the University of Cambridge, UK.10 In 2011, a collaboration between the California Department of Public Health, Metropolitan Transportation Commission, the Bay Area Air Quality Management District, and the UK researchers produced the first US version calibrated to the San Francisco Bay Area. Since 2012, ITHIM has been implemented as a spreadsheet for California regions and counties (Sacramento, Los Angeles, San Diego, Fresno), and has become a template for other states and cities in the U.S. In 2019 an open source R/Shiny web-based application was developed by the University of California, Davis under a contract from the California Air Resources Board. In 2020, the template created by California ITHIM was updated and recalibrated with national data for ITHIM USA.
Recommended citation: Maizlish N, Jiang C, and placeholder authors. ITHIM USA. Berkeley, CA; 2020, based on work of Maizlish N, Tomari K, Jiang C, Weiher A, Grajdura S, London JK, Rudolph L. California ITHIM, R/Shiny Version. User's Guide and Technical Manual. Davis, CA: University of California; 2019. Assistance from Kelly Rodgers is gratefully acknowledged. James Woodcock, Ali Abbas, and Bart Ostro are gratefully acknowledged for their assistance with dose response functions.
References
Instructions
Choosing Scenarios and Time Periods
To generate reports, tables, graphs, infographics, or an "elevator pitch", you must select one option from each of two pick lists in the Run ITHIM page:
- Scenarios
- Time Periods
Scenarios
Scenarios are future travel patterns. They may be the result of new policies, plans, programs, and investments, which increase or decrease the daily distance and time a typical person walks, cycles, rides transit, or drives in a car. These distances and times can be compared to those from ITHIM's baseline year of 2015. One scenario that reflects national health goals, based on the US Surgeon General's recommendations for physical activity for adults, is programmed into ITHIM. Other scenarios allow you to set your own goals for the weekly amount of physical activity through walking and cycling. More technically inclined users can upload their own scenarios, including a comparison, called business-as-usual (BAU), which projects current travel trends and plans (status quo) to a future year. Scenarios are described in more detail in Scenarios.
Time Periods
Over next three decades, the U.S. population is expected to increase to nearly 400 million and grow older. Trends in population health also indicate that death rates will continue to decline due to improvements in public health and medical care. Using population and mortality projections of the U.S. Census and U.S. Social Security Administration from 2010 to 2050, ITHIM can evaluate health outcomes of future travel plans. You can pick a specific 5-year time period for your assessment of health impacts. A complete list of options is presented in Time Periods.
States/Other Geographies
ITHIM USA is currently calibrated for the entire United States using uniform national data sources, several of which sample a small portion of the US population. The entire sample must be pooled to give statistically reliable information. Thus, estimates for individual states are not available. Some states and metropolitan planning organizations (MPO) carry out their own household travel surveys, and, using these alternative data sources, versions of ITHIM have been created for California, Oregon, Maryland, Massachusetts, and Vermont. Users interested in adapting ITHIM for their own state, MPO, or other jurisdiction should consult ITHIM documentation at User Support.
Scenarios
What Scenarios Are Available in ITHIM USA?
ITHIM contrasts current travel patterns to that of an alternative scenario. Scenarios can be aspirational goals: "What if we doubled or tripled walking and cycling from current levels?", or, projections of travel times and distances suggested by policies, plans, and investments affecting land use, housing, and the transportation system. Below are scenarios built into ITHIM USA .

Baseline 2015
Scenarios are contrasted against travel patterns of the baseline year of 2015. The National Household Travel Survey, 2017 provided detailed information on trips by travel mode (walk, bicycle, car, motorcycle, bus and rail) for a representative cross-section of the U.S. population. Truck travel was based on data the Highway Performance and Monitoring System (U.S. Department of Transportation). Unless you upload your own baseline data, the 2015 Baseline will be the comparison for other scenarios, which are briefly described below.

Popularly known as "the Nation's Doctor", the U.S. Surgeon General focuses on improving the country's health. Based on a review of decades of research on the relationship between physical activity and health, the Surgeon General has stated that "engaging in regular physical activity is one of the most important things that people of all ages can do to improve their health." For adults, an optimum level of health can be achieved by engaging in at least 150 minutes of moderate-intensity physical activity each week. For ITHIM USA this recommendation has been translated into a population health goal in which at least 50% of Americans, through active transportation, get 150 minutes per week of moderate physical activity. In 2018, 54% of American adults and 26% of adolescents met national physical activity goals.
Baseline Multiples
This is a "What-If" Scenario in which you can assess the health impacts of increasing the average baseline walking and cycling for transport by relative amounts (e.g., 1.10 indicates a 10% increase, 2.00 indicates a 100% increase). This scenario allows you to input any multiple of the 2015 baseline average of walking, cycling, or transit.

Fixed Time
This is a "What-if" scenario allows you to specify the average weekly minutes of walking and cycling for transport.

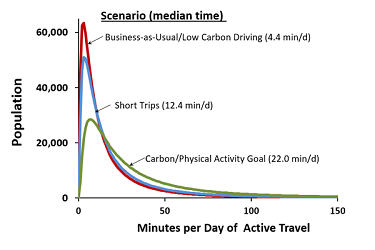
Short Trips
Nearly two-thirds of all car trips in the United States are less than 5 miles. In this scenario, we envision half of these trips are walked or bicycled. Trips less than 1 miles are walked (20 minutes per day), and trips 1 to 5 miles are cycled (6 to 30 minutes per day).
Low Carbon Driving (LCD)
In this scenario, car travel reflects a significant increase in electric vehicles, hybrids, and low carbon fuels. You can input the percent of vehicle miles traveled (VMT) that are carbon-free from full electrification of cars. This scenario assumes there is no change from baseline in total car VMT or levels of active transportation. In addition to significantly lowering greenhouse gas emissions from cars, low carbon driving reduces health risks from tailpipe emissons of fine particulate matter. Particulate matter ("road dust") formed from tire and brake wear is not eliminated by electric vehicles.

User Upload and Equity Analyses
If you or your organization have access to a travel or land use model, you can assess the health impacts of your own baseline, business-a-usual, and other scenarios by uploading travel distances and times for different modes of travel. Likewise, data can be uploaded to carry out analyses of population subgroups based on race/ethnicity, income, and other factors that influence health equity. Details on how to prepare files for uploading and equity analyses are described in the ITHIM User's Guide & Technical Manual.
Time Periods
What Time Periods Are Available in ITHIM USA?
Transportation planning considers trends in population, jobs, and housing that take place over decades. ITHIM USA offers options to assess annual health impacts in future years up to 2050. The U.S. population is expected to increase in size and will have a greater share of older people. Improvements in public health and medical care are expected to lower disease and death rates for most chronic diseases and injuries. ITHIM USA takes these factors into account for future years, which are represented by estimates in 2015 and 5-year intervals from 2015 to 2050 based on projections from the U.S. Bureau of the Census and the U.S. Social Security Administration.
| Time Periods |
|---|
| 2015-2019 |
| 2020-2024 |
| 2025-2029 |
| 2030-2034 |
| 2035-2039 |
| 2040-2044 |
| 2045-2049 |
| 2050-2054 |
Methods
How Does ITHIM Work?
Health Risks and ITHIM Health Pathways
Health scientists have spent decades researching the relationship between physical activity, air pollution, and chronic diseases.1,2 Across many studies in United States and other places, they have been able to generalize how every extra minute of physical activity reduces chronic diseases such as heart disease, stroke, diabetes, dementia, depression, and colon and breast cancers. Many of these studies focus specifically on walking and cycling. Likewise, decades of scientific research have demonstrated how ambient concentrations of fine particulate matter (PM2.5) increase the frequency of chronic diseases, such as asthma, chronic obstructive lung disease, heart disease and stroke, and upper respiratory illnesses in children. For traffic collisions, we can estimate the number and rate of fatal and severe injuries per mile traveled by victims and the vehicles that struck them by travel mode. Baseline injuries can be compared to those predicted from changes in distances traveled by each mode in the scenario and baseline injury rates.
In ITHIM we apply this general knowledge to a population with contrasting travel patterns. For example, compared to the baseline, a scenario with extra physical activity from active travel will reduce chronic disease. Likewise, in a scenario with less car travel, there will be less tailpipe emissions, which will lead to lower ambient levels of PM2.5 and reduced risk of lung cancer, respiratory diseases, and heart attacks.
We can express the difference in disease or death rates from the baseline and scenario in terms of a percent change from baseline. This percent change is given a technical name called the population attributable fraction, PAF. If we multiply this percent change by the annual number of deaths and disease in the population, we can estimate the annual change in health status from a change in travel-related physical activity, air pollution, and traffic collisions .
Burden of Disease
ITHIM uses a concept of health that idealizes an entire population achieving the highest possible life expectancy without getting ill before dying. The highest life expectancy can be defined by a geographic or other subgroup with favorable health status (e.g. countries with a similar level of economic development). For example, a life expectancy of 82 years for women and 80 years for men may be a model for places like the United States.
In this concept of health, deaths that occur before the benchmark life expectancy are considered premature, and the years between the benchmark and actual age of death are considered "years of life lost." Similarly, years between the benchmark and the age of onset of a disabling disease or injury, are termed "years of living with disability." In a population with optimum health, everyone would reach life expectancy without disability. In such an idealized population, the burden of disease would be zero --- neither years of life lost nor years living with disability. Real populations do not measure up to this ideal. The higher the disease and death rates experienced at each age, the greater the number of years of life lost and years living with disability. The accumulation of these years of life lost and living with disability is called disability adjusted life years (DALYs), and this is how "the burden of disease" is defined in ITHIM. This approach has the distinct advantage of putting fatal and non-fatal health conditions on a common scale. This approach significantly elevates the role of mental health in the burden of disease, compared to approaches that only consider death.
The World Health Organization has created a standard methodology for calculating the burden of disease and injury, which is published and periodically updated. ITHIM uses the published data for the United States.
With the U.S. burden of disease and population attributable fraction (above) it is possible to measure the health impacts contrasting travel patterns as a change in the burden of disease:
Change in the Burden of Disease = Population Attributable Fraction × Burden of Disease
Because the burden of disease and patterns of walking and cycling vary strongly by age and gender, ITHIM USA calculates the change in deaths and DALYs for each specific disease and road traffic injuries by 8 age groups and 2 genders (16 groups total). The impact for a specific disease is calculated by summing over age and sex. The overall impact is given by summing the change in burden over the all diseases and road traffic injuries. Additional technical details and updates to this method are published regularly.3
What Are Key Assumptions in ITHIM USA?
Physical Activity
ITHIM models a distribution of travel-related physical activity based on the mean and standard deviation of active travel time for the entire population. Physical activity is weighted to reflect its energetic intensity using marginal Metabolic Equivalent Task (mMET) units. On the mMET scale, being awake and at rest is set to 0, walking is 2.5, and cycling is 5. The mean travel time is based on assumed travel speeds (3 mph for walking and 12 mph for cycling), distances of x-y coordinates of trip origins and destinations reported in household travel diaries, and the presumed direct GoogleMaps route. This created a coherent data set in which travel times, distances, and speeds were realistic and in sync, but may not account for unreported or misreported trips.
Non-travel physical activity was assumed to be unaffected by increased active travel in scenarios. Some researchers claim that people who increase active travel have a concomitant decrease in their leisure physical activity ("activity substitution"); however, given that 76% of Americans have low or no regular physical activity,4 there may be low levels from which to substitute.
Air Pollution
Air pollution exposures were expressed as annual average ambient levels. This does not take into account seasonal, urban/rural, or small area variation (e.g. hotspots near busy roadways, ports, etc.) in which ambient levels may be significantly higher or lower.
The microscale exposure of active travelers near busy roadways is not taken into account. Active travelers have higher ventilation rates (breathe harder) than sedentary travelers, and may have a higher inhaled dose of air pollution compared to the same activity done just a few blocks away or in uncontaminated areas. It should be noted that people traveling on the same busy roadways in automobiles may experience elevated pollution levels in the cabins of their cars although their ventilation rates may be lower than active travelers. The duration of active travel time in which air pollution exposure may negate the benefits of physical activity appears to be rarely achieved in settings below 50 µg/m3. 5,6 As a reference, the U.S. standard for PM2.5 is 12 µg/m3 annual average.
Road Traffic Injuries
The rate of traffic collisions appears to be dependent on mode share. Especially for pedestrians and cyclists, but apparently for all modes, road traffic injuries tend to decrease as the share of pedestrians and cyclists increase. This phenomenon has been called "safety in numbers." ITHIM incorporates a safety in numbers factor based on the midpoint of values reported in scientific studies.7
Data were not available to classify the amount of walking or cycling on local roads and arterials, which influences injury risk (as a proxy for traffic speed and volume). We assumed that 75% of walking was on local roads and 25% were on arterials. For cycling, we assumed 47% was on local roads and 53% was on arterials. We assumed near zero levels of walking and cycling on highways.
Downscaling Health Impacts
Travel patterns vary by state, regions within states, and county. Because calibration data lack statistical reliability for state estimates, ITHIM USA currently does not provide estimates for states, regions within states, or counties. ITHIM USA is most appropriate for national estimates of health impacts due to changes in active transportation. ITHIM adapted for Massachusetts, Maryland, and California take into account regional or county variations in travel patterns and health characteristics.
What Are Key Limitations of ITHIM USA?
Design and Impact of Scenarios
ITHIM USA assesses the health impacts of scenarios, but does not provide guidance on how scenarios are constructed or what combination of policy, systems, or environmental change will produce a specific scenario or impact. In the Decision Support section of this website, we have compiled evidence from the literature to assist users identify the magnitude and direction of different strategies and their impacts on health. We hope this information can guide you in the design and interpretation of scenarios.
Geographic Scale
An important limitation is availability of geographically refined data on active travel. The primary source of information on walking and cycling was from the National Household Travel Survey, 2017. When broken down by age and gender, most states had few observations, particularly of older cyclists. ITHIM USA represents the family of ITHIM models that aggregate population data ( i.e. age and gender). Geographic variation in travel patterns can be missed in this approach. Versions of ITHIM that simulate travel and health of individuals with fine geographic resolution are under development at the University of Cambridge and several other universities.8
Time Scale
Although ITHIM USA estimates annual health impacts at a future year, it does not provide snapshots of the ramping up of health impacts from the baseline year to the year of analysis.
Population Characteristics and Equity Analyses
ITHIM USA breaks down the U.S. population into discrete subgroups by active travel mode, age and gender, all of which are important aspects of equity. We have created the ability for users to upload single equity variables (i.e. race/ethnicity or income) that can be analyzed in combination with age and sex (See User Support). Analyses based on numerous additional combinations of variables often become infeasible when the source of data is a sample survey. This arises because some of the combinations of age, sex, mode, geography, etc. may have no or few observations ("small" or "sparse" cells). The National Hosuehold Travel Survey - the source of active travel data - sampled only 130,000 of the 118 million U.S. households. Future versions of ITHIM models are being designed to incorporate statistical methods that measure the impact of several simultaneous equity variables on travel patterns and health outcomes.
Dose-Response Relationships and Health Outcomes
Newly published scientific studies continually update the dose-response relationship between environmental exposures and health outcomes. For physical activity and fine particulates, the data in ITHIM USA were informed by studies up to 2018.9,10 The studies include health pathways and outcomes that are already included in ITHIM USA, and new pathways and health outcomes. For physical activity, we now include lung cancer as a health outcome. Improved quality of sleep, enhanced cognitive and executive functioning, and reduced risk of falls in older adults are several other health outcomes associated with physical activity. For air pollution, we have not yet included pollutants such as oxides of nitrogen (NOx) and ozone that impact cardio-respiratory or cancer outcomes. For road traffic injuries, we are use national collision data to in 2016.11,12 There is sufficient evidence that excess noise has a deleterious impact on health. This pathway has not been yet incorporated into ITHIM USA. These limitations contribute to underestimating health impacts.
Other Caveats
ITHIM is not a health risk calculator for individuals. It is designed to characterize population level health impacts.
References
Photo Credits
All photos are licened through Creative Commons for non-commercial use with attribution: Register's Annual Great Bicycle Ride Across Iowa, ragbrai.com (Home); Manhattan Pedestrians by City Clock Magazine (Introduction); Expect Pedestrians by Seattle Department of Transportation (Instructions); Before/After Bruckner Blvd Improvements by New York City Department of Transportation (Scenarios); Monorail by Mike Christoferson (Time Periods); Duck Trail Survey by Institute for Transportation Research and Education (Methods); Bike Tool by Julia Schmidt (Run ITHIM); Summer Streets by New York City Department of Transportation (Health Outcomes); Strategy Session by Impact Hub(Strategies); Critical Mass, Denver by Andy Bosselman (Physical Activity); Safety City by New York City Department of Transportation (Safety); Denver Smog by US Department of Energy (Air Pollution); Manhattan Gridlock by Stefan Georgi (Evidence); Road Traffic fatalities by International Transport Forum (Data & Resources); Mutual support by Rawpixel Ltd (User Support).
The ITHIM Tool
Health Impacts of Travel Scenarios in the United States
In 2015, U.S. residents spent an average of 6.4 minutes a day walking or cycling for transportation. In contrast, the daily average for car commuting was 51 minutes. Below you can explore the health impacts of increasing (or decreasing) active travel from the 2015 baseline by choosing a travel scenario that incorporates goals, plans, or data that you can upload.
To generate results, pick one item from each of the picklists for Scenarios and Time Periods. The results include a brief summary report, an infographic, tables and charts that describe the number of deaths and years of life shortening avoided or added to existing levels of chronic diseases and injuries in the United States. You can click buttons to set the level of detail in the output.
Need Help? Find step-by-step instructions here.
ITHIM TOOL
Health Outcomes
To put ITHIM in a United States context, we provide information on the prevalence and costs of chronic diseases and injuries related to lack of physical activity, air pollution, and traffic collisions. In addition to the specific diseases in ITHIM, we include other health conditions that scientific studies link to environmental hazards in the transportation system. We also highlight how disease and injury rates vary by race/ethnicity, income, geography, and modes of transportation. We describe how communities experience different opportunities in the transportation system, which, in turn, may influence health equity. We link to key documents that summarize the scientific evidence for the transportation-health connection.
Physical Activity
Physical activity has a wide-ranging positive effect on mental health, well-being, and the quality of life. These include reducing depression and anxiety, preventing and minimizing weight gain in adults, which slows a progression to obesity, itself a major health concern for both children and adults. Physical activity also improves the quality of sleep and reduces fatigue, and contributes to better functioning at work and school.1 Physical activity has a profound influence on chronic diseases that account for more than 60% of U.S. deaths2 and $3.15 trillion in annual health care costs.3
Of the 2.8 million Americans who died in 2016, approximately 224,000 ( 8.3%)4 are estimated to be due to lack of physical activity. These include:
- Ischemic Heart Disease
- Hypertensive Heart Disease
- Stroke
- Dementia
- Depression
- Diabetes
- Cancer (breast, bladder, colon, endometrium, esophagus, kidney, lung, and stomach)
- Falls (particularly in older adults).
The toll of these diseases falls unequally across different population groups. Compared to Whites, African Americans have twice the death rate from diabetes, hypertensive heart disease, and asthma and 40% higher death rates from stroke, colon cancer, and breast cancer. Diabetes deaths are also elevated in Native Americans and Latinos. In addition to race/ethnicity, there are pronounced differences in mortality and illness rates that vary by income, education, and geographic area. In general, lower income and educational attainment are associated higher mortality from chronic disease. Compared to other residents, those living in the South have higher rates of chronic illness.5
Rates of walking and cycling also vary by race/ethnicity and income.6 In general the prevalence of walking or cycling to work is greater in low income and non-white groups. Living in urban neighborhoods with highly gridded street networks and the expense of owning and operating a car may account for higher levels of active travel. Low income travelers also predominate in public transit systems. These observations suggest that active travel in low income and some race/ethnic groups may play a key role in ameliorating poor health outcomes. This may not compensate for low car ownership, which limits accessibility to employment and other opportunities that contribute to health.
Road Traffic Collisions
In 2016, more than 37,000 Americans died from motor vehicle injuries and more than 190,000 sustained serious injuries.7,8 Compared to motorized modes, pedestrians and bicyclists bear a disproportionate risk of death. Bicyclists accounted for just 1% of all trips7 taken in 2017, but generated 2.5% of fatal injuries. Pedestrians accounted for 10% of trips, but 18% of traffic fatalities. Compared to occupants of cars, U.S. bicyclists experienced 11 times the risk of death per mile traveled, and pedestrians experienced 19 times the risk of death per mile traveled.5,9
Between 2010 and 2017, U.S. fatality rates (per 100,000 population) for active travel have increased at an annual rate of 4% for walking and 2.7% for cycling.5,10 This contrasts with western countries that have much lower rates that are trending lower over time.11 The Centers for Disease Control estimated 2017 U.S. medical costs and work losses from fatal motor vehicle crashes at $75 billion. Costs to pedestrians and cyclists exceed that of occupants of motor vehicles.12
Disparities also exist within travel modes by age, gender, race/ethnicity, and socioeconomic status. Black and Native American pedestrians in 2017 had more than twice the death rate per capita than the U.S. average. Likewise, Native Americans have higher per capita rates of bicycle fatalities than other race/ethnic groups. The risks of a traffic fatality is 2.3 times greater per mile traveled in rural compared to urban areas.8,13
Air Pollution
Fine particulate matter with an aerodynamic diameter of 2.5 microns (PM2.5) is a component of air pollution associated with serious health effects. These include:
- Ischemic Heart Disease
- Hypertensive Heart Disease
- Stroke
- Respiratory Diseases (asthma, inflammatory heart disease)
- Acute respiratory tract infections in children (< 5 years of age)
- Lung cancer.
While not definitive, evidence suggests that PM2.5 is linked to diabetes14 and may increase the frequency of adverse birth outcomes such as low birth weight and preterm birth.15
In addition to PM2.5, other common chemical constituents of air pollution have demonstrated harmful effects on human health. These include ozone (O3), particulate matter with an aerodynamic diameter of 10 microns or less ( PM10), nitrides of oxygen (NOx), carbon monoxide (CO), and sulfur oxides (SOx). These pollutants impact respiratory function and heart health, too.
B132 17Additional information on air pollution and health is available.18
In the transportation sector, on-road vehicles account for approximately 19% of annual anthropogenic PM2.5 emissions.19 Proximity to busy highways has been associated with adverse health effects, including exacerbation of asthma.20 A recent report21 based on air pollution models highlights the equity dimensions of PM2.5 emitted from California's cars, trucks, and buses:
- The lowest income households have PM2.5 levels that are 23% higher than the highest income households.
- African Americans have exposure levels 49% higher than Whites; Latinos have levels 39% higher and Asians have 21% higher levels than Whites.
- Residents of Los Angeles County experience PM2.5 levels 60% higher than the state average and 2.5 times those of San Francisco Bay Area residents.
- Households without a car experience higher background levels of vehicle pollution than households that own a car in part because they tend to live in urban areas surrounded by traffic.
Physical Activity Near Busy Traffic
The physical exertion of pedestrians and cyclists cause them to breath heavier than when they are resting. If they are active near busy roadways, they may inhale more air pollution than motor vehicle passengers along the same road. When might the harms of air pollution in active travelers negate the positive effects of their physical activity? The conclusions based on of multiple studies22 are:
- Proximity to traffic and high air exchange rates inside vehicles increased the exposure to air pollution of passengers in vehicle cabins.
- Higher ventilation rates and commuting time increased inhaled dose among active travelers.
- The benefits of active travel from physical activity are larger than the risk from an increased inhaled dose of fine particles.
Extreme situations that would negate the benefits are infrequently encountered in the United States, and one study23 suggested that a bicyclist exposed to an annual average of 50 µg/m3 of PM2.5 would have to be in continuous motion 5 hours daily before the air pollution exposure would diminish the health gains from physical activity. Many active travelers are sensitive to route choice for safety concerns as well as air quality, and consciously avoid busy roadways.
Noise
Recent systematic reviews of the scientific literature support a causal role of traffic noise increasing the incidence of ischemic heart disease.24
References
14. Dendup T, Feng X, Clingan S, Astell-Burt T. Environmental risk factors for developing type 2 diabetes mellitus: A systematic review. Int J Environ Res Public Health. 2018;15(78)
15. Guo L, Chen Y, Mi B, Dand S, Zhao D, Liu R, et al. Ambient air pollution and adverse birth outcomes: a systematic review and meta-analysis. Journal of Zhejiang University-SCIENCE B (Biomedicine & Biotechnology). 2018.
22. Cepeda M, Schoufour J, Freak-Poli R, Koolhaas C, Dhana K, Bramer V, et al. Levels of ambient air pollution according to mode of transport: a systematic review. Lancet Public Health. 2017;2:e23:e34.
23. Taino M, Monsivais P, Jones N, Brand C, Woodcock J. Mortality, greenhouse gas emissions and consumer cost impacts of combined diet and physical activity scenarios: a health impact assessment study. BMJ Open. 2017;7:e014199.
24. van Kempen E, Casas M, Pershagen G, Foraster M. WHO Environmental Noise Guidelines for the European Region: A Systematic Review on Environmental Noise and Cardiovascular and Metabolic Effects: A Summary. Int J Environ Res Public Health. 2018;15(379).
Introduction
ITHIM USA quantifies the health co-benefits of active travel. The calculations by themselves do not shed light on what combination of plans, policies, projects, and investments may be required to achieve the health benefits. To educate and stimulate discussion, we provide additional information organized by three strategies that mirror the health focus of ITHIM USA:
- Increase physical activity
- Increase safety
- Decrease air pollution, greenhouse gases, and vehicle miles traveled (VMT)
The three strategies are interconnected, and lack of safety is a major reason for not walking or cycling, which increases car dependence.
Within each strategy, we categorize information by policy, systems, and environmental change (PSE). Policy change involves institutionalizing rules or procedures at the legislative or organizational level through laws, ordinances, resolutions, and regulations. Systems change involves changing rules or procedures within an organization. Environmental change is made to the physical environment that impacts community level resources and populations.
This framework is used in public health to craft holistic solutions to challenges such as the chronic disease epidemic and road traffic injuries. PSE recognizes that individual choices and behaviors that impact health are shaped by the larger fabric of society known as the "social determinants of health". Education, economy, housing, transportation, social support, neighborhood built environment, environmental pollution, and health care access are among these determinants. While our focus is the transportation system, other sectors interact with transportation and play important independent roles in health.
Increase Physical Activity
Increases in active travel can be achieved through policy, systems, and environmental change in:
- Transportation systems, and
- Land use.
Transportation
Policy
Prioritize Active Travel in the Street User Hierarchy
A street user hierarchy is a framework for transportation policies, and prioritizes modes from a design perspective. A street hierarchy that prioritizes active travel would rank street users in the following order: pedestrians, cyclists, transit users, freight transporters, taxi drivers, and private-vehicle drivers.
Complete Streets
Complete streets are sidewalks, crosswalks, bike lanes, roadways, bridges and other transportation facilities that are designed and operated to enable safe access for all users, including pedestrians, bicyclists, motorists and transit riders of all ages and abilities. Legislation in many states requires their counties and cities to update comprehensive plans (general plan in California) to provide a balanced, multimodal transportation network that meets the needs of all users of streets, roads, and highways. Over 1500 Complete Streets policies have been passed in the United States, including those adopted by 35 state governments. Below is a link to a Complete Streets policy inventory and case studies from around the United States.
Health in All Policies
Health in All Policies is a strategy to include health considerations in policy making across multiple sectors that play a major role in determining the health of populations. These include economy, transportation, agriculture, land use, housing, public safety, and education. It is a collaborative framework that shares information, tools and assessment techniques of policies, projects, and plans such as Health Impact Assessment (HIA).
State and local health departments around the United States are increasingly adopting Health in All Policies (HIAP) approaches. California's HiAP Taskforce is the most mature expressions of this movement in the United States. Established in 2010, the Taskforce is made up of 22 California state agencies and created an Active Transportation Action Plan which guides grant-making in transportation programs; promotes active transport through the dissemination of information and tools, and planning documents; promotes active transportation among state employees; and, evaluates active transportation programs. Case studies from around the world, addiitional information about the California HiAP Taskforce and its action plans, and implementation guides for local health agencies and non-profit organizations are available.
Systems
When new policies are adopted to accommodate pedestrians or cyclists, organizations need to realign their practices. Re-writing a mission statement, design manuals, project solicitations, or educational materials, and updating administrative rules are examples of system changes that remove physical and administrative barriers to active travel.
- Implement design guidelines for walking and cycling in new projects and plans
- Allow bicycles on transit systems
- Allow bicycles in designated areas on bridge crossings
- Consider contraflow cycle paths
- Increase the number, frequency, and hours of transit routes
- Improve the coordination of travel connections between routes and transit carriers
- Consider discount fares for students, seniors, low-income riders.
Environment
Among the most important environmental factors influencing active transportation is infrastructure. Sidewalks and other pathways provide direct access to destinations and are a final link with other travel modes. There are many other aspects of infrastructure that facilitate active travel by providing a physical medium for travel or by enhancing the safety and comfort of pedestrians and cyclists of all ages and abilities. Examples of infrastructure are listed below with resource links to details of their function and design.
Walking and Cycling:
- Separation/buffers
- Paved shoulders
- Landscaping
- Trails or shared-use paths
- Signage, especially high-visibility signage
- Traffic calming (e.g., curb extensions)
- Overpass or underpass
Walking:
- Pedestrian scale lighting
- Sidewalks
- Signalized pedestrian crossings and mid-block crossings
Cycling:
- Access to bicycles (own, rent, share)
- Electric bikes for hilly topographies and riders needing pedal-assist
- Cargo bikes
- Bicycle lanes
- Bicycle parking and storage facilities
- Intersection treatments for bicycles (bicycle boxes, stop bars, lead signal indicators)
- Bicyclist-scale lighting
- Shared-lane markings ("sharrows")
Transit:
- Bike racks on trains, light rail, and buses
- Dedicated bicycle areas within rail cars
Resources
Land Use
Land use and topography have a profound influence on the number trips and distances between origins and destinations. Land use also influences the directness and time, safety, and comfort of the route. Land use characteristics that influence travel have been summarized as the 5 "Ds":
- Density: residents, households, jobs, employers per square mile
- Diversity: mix of land uses --- residential, retail, commercial, parks and recreational
- Design: interconnectedness of the roadway network, degree of griddedness, block length
- Destination: accessibly to jobs, educational opportunities, healthcare facilities, and other necessities
- Distance to Transit: within a walkable or bikeable distance to transit stops.
Hilliness and natural barriers also presents a challenge to pedestrians and cyclists in getting to destinations.
Policy
- Increase the role of active travel and health in the rules of development: general and regional transportation plans, land use ordinances and zoning
- Manage urban growth and discourage the outward expansion of sprawl at the regional or metropolitan level
- Reduce fiscal competition among local governments. Municipalities that favor high revenue-low service demand development (e.g., big box retail) risk exacerbating a jobs:housing imbalance and increase commuting distances.
- Improve school siting so more students can walk or bicycle to school
- Give funding priority and incentives to compact development projects and transit-served areas
- Streamline transit-oriented projects in administrative review
- Redirect transportation funds from road expansion to transit, bike, and pedestrian facilities.
Systems
- Adopt pedestrian- and bicycle-friendly site and building design standards
- Parking policies.
Environment
- Increase smart growth projects
- Provide for workforce housing near jobs.
Resources
Increase Safety
Active travel may increase pedestrian and cyclists' exposure to motorized traffic. Many of the policies, systems and environmental changes to Increase Physical Activity overlap with Increase Safety. PSE that focuses primarily on safety are described below.
Policy
Federal legislation (Title 23 of the United States Code, Section 217) provides funding mechanisms, planning requirements, and policy tools necessary to create more walkable and bicycle-friendly communities. Each state has a bicycle and pedestrian coordinator, who serves as a point of contact for the Federal Highway Administration. The Federal Highway Administration also offers guidance documents as a resource for state and local governments to support the implementation of best practices for active transportation. Advocacy organizations also provide resources for policy development, funding strategies, best practices and case studies for safe active transport.
- Legislation
- Guidance
- Directory of State Bicycle and Pedestrian Program Coordinators
- Transportation for America: State Transportation Policy and Funding
Noteworthy examples, including emerging policies, are presented below.
Vision Zero is both a policy and a program that has been adopted by more than 40 cities across the United States. Vision Zero acknowledges that multiple factors contribute to safety --- including roadway design, speeds, behaviors, technology, and policies --- and sets clear goals to achieve the ultimate goal of zero fatalities and severe injuries. Vision Zero emphasizes cross-disciplinary collaboration among local traffic planners and engineers, policymakers, and public health professional. Vison Zero recognizes that although human error can minimized, it cannot be not completely eliminated. Thus, the road system and related policies should be designed to anticipate inevitable mistakes and ensure they do not result in severe injuries or fatalities. Vision Zero is data-driven and uses mapping technology to identify and target preventive interventions to specific street segments where a disproportionate number of injuries occur. Vision Zero also prioritizes community engagement and has an equity focus.
Safe Routes to School is a national movement that aims to make it safer and easier for students to walk and bike to school. Since 2005, more than 400 programs have been established in 44 states. The framework for accomplishing this is a PSE approach focusing on six "E's" --- Education, Encouragement (incentives), Engineering, Equity, Enforcement, and Evaluation. The organization provides technical support to initiate and maintain Safe Routes to School Programs in their communities.
Driving While Impaired
Approximately 28% or 10,497 of U.S. traffic fatalities in 2016 involved drivers with elevated blood alcohol levels (>0.08 g/dl).1 The risk of a fatal traffic collision increases exponentially above a blood alcohol level of 0.04 g/dl (0.04%).2 All states prohibit the operation of motor vehicles while under the influence of alcohol, and set a threshold level in blood such as 0.05 g/dl (Utah) or 0.08 g/dl (other states). Countermeasures include:
- Drunk driving laws
- Sobriety checkpoints
- Ignition interlocks
- Multi-component interventions (e.g., community mobilization by involving coalitions or task forces in design and implementation)
- Mass media campaigns
- Administrative license revocation or suspension laws
- Designated driver
- Alcohol screening and brief interventions
- School-based instructional programs.3
Distracted Driving
Distracted driving encompasses a range of behaviors that take drivers' eyes off the road, hands off the wheel, or mind off driving. These include talking, dialing, or reaching for a cell phone or other object in the car; adjusting the car's temperature or radio controls; eating, drinking or looking at a crash or something else outside the car; or adjusting a mirror, seatbelt, or window in the car. In 2018 at any point in time, approximately 5.3% of U.S. drivers engaged in distracted driving due to electronic devices, and, in 2017, nearly 909,000 drivers were involved in distracted driving collisions in the United States.4 Nationally, distracted driving was implicated in 9% of all traffic fatalities.1 As of 2017, state laws prohibit use of a handheld cellphone (15 States) or texting (47 states) while driving .
Countermeasures include improved data collection and observational surveys, increased and focused enforcement and adjudication, public awareness and education campaigns, and strengthening laws to include negligent operator points to change behavior.
Graduated Driver Licensing Systems
In 2017, the U.S. rate of fatal motor vehicle injuries increased rapidly from 1.7 deaths per 100,000 population at ages 10 to 15 to a peak of 16.6 per 100,000 at ages 21 to 24 years.5 The inexperience of young drivers is a contributing factor. All states have some form of graduated driver licensing programs. Current best practices in the United States are a minimum permit age of 16 and at least 70 supervised practice hours, a minimum license age of 17 (after passing a road test), a night driving restriction starting at 8 p.m. and a ban on all teen passengers.
Systems
Excessive speed contributed to 31% of U.S. traffic fatalities6 between 2005 to 2014. The risk of a fatal injury to pedestrians increases exponentially at motor vehicle speeds above 17 miles per hour.7 In theory, lowering speed decreases injury risks.
Setting Speed Limits
Historically, speed limits are set by state and local authorities relying on judgement of professional organizations (American Association of State Highway and Transportation Officials) and engineering studies that take into account operating speed, traffic volume, topography, adjacent land use, and road type (local, collector, arterial, highway). Stakeholders can request changes to speed limits, and limits can be adjusted to conform to an "85% percentile rule", which is codified in roadway design manuals.8 This rule assumes that the speed that matches the design and operations for a roadway segment is achieved at the 85th percentile of driver speeds. Concerns have been raised that this rule has led to an undesirable escalation of speeds and reduced safety.6 Setting speed limits using a "safe systems" approach is an alternative embraced by Vision Zero. It does not assume that drivers always select safe speeds and prioritizes injury potential, which is supported by data collection and evaluation.
Enforcement
Enforcement of speed limits falls to state and local police departments which must consider staffing levels, equipment, data processing and court time. Optimal enforcement often requires resources beyond those available. To better use resources, one strategy is to geographically target roadway segments that have a high risk of collisions. Geographic information systems provide a data-driven approach to traffic safety and crime prevention. The same approach can use road traffic injury data to monitor the impact of interventions (such as increased enforcement).
Automated Speed Enforcement (ASE)
The use of vehicle speed detectors coupled with a camera to identify speeding vehicles is a technology-based approach that can greatly expand enforcement capacity. A speeding vehicle triggers a camera that photographs the vehicle license plate, and, after an off-site review, a citation may be mailed to the vehicle owner. Several evaluations has led the National Transportation Safety Board and the Centers for Disease Control and Prevention to endorse the effectiveness of this approach. In 2015, red-light cameras were deployed in 460 communities in 24 States. Speed cameras were being used in approximately 134 jurisdictions in 12 States.
ASE has several limitations. Drivers, oblivious to their speeding during the triggering episode, may continue speeding during the rest of their trip. The deterrent effect may be muted with a long feedback period until a citation is generated. Concerns have been raised over privacy, equity (disparate siting of ASE in poor neighborhoods), and the misuse of ASE to enhance revenue generation for municipal government.
Enforcement of Personal Protective Equipment
Laws mandating the use of seatbelts, child safety seats, motorcycle helmets, and bicycle helmets have been have been on the books since the early 2000s. These laws and their enforcement are credited with saving thousands of lives across the United States.9
Health Equity and Enforcement
Racially disparate enforcement of traffic safety laws is well-documented in the United States.10 This includes both drivers of motor vehicles (traffic stops) and pedestrians and others present on streets (street stops). The reality and perception of discriminatory behavior from law enforcement activities has adverse health outcomes through several recognized pathways. These include 1) reduced access to resources (employment, housing, education) and/or increased exposure to the criminal justice system; 2) adverse cognitive/ emotional psychopathology; 3) chronic stress and its associated physio-pathology, 4) diminished participation in healthy behaviors (e.g., sleep and exercise) and/or increased engagement in unhealthy behaviors (e.g., alcohol consumption); and 5) physical injury as a result of racially-motivated violence.11
To advance health equity, all policy, systems, and environmental changes in transportation should be developed and evaluated with a racial equity lens.Education
Safety education programs are a cornerstone of increasing safety for pedestrians, bicyclists, and motor vehicle drivers. Programs are offered by governmental agencies, educational institutions, and advocacy organizations. They typically provide age-appropriate information on pedestrian and bicycle safety best practices and a range of strategies to address and improve pedestrian and bicycle safety conditions using a 6-E framework: engineering, enforcement, education, evaluation, encouragement, and empowerment. Programs offer a combination of free classroom, on-line and in-the field instruction and events (group riding). They all broadly promote a safety culture and change norms. Materials for organizers, non-English speakers, and certification of instructors are also available. Several programs and a national directory of programs are listed below.
Emergency Medical Services/Response
A seventh "E" --- emergency medical services --- is recognized to reduce post-collision motor vehicle mortality and morbidity. This includes response time of emergency medical personnel to crash sites12 as well as life-saving medical technology.
Environment
Most infrastructure interventions for safety have already been listed in Increase Physical Activity. Several other factors also contribute to increasing safety:
- Smart infrastructure/vehicles
- Violence and incivility
"Intelligent Transportation Systems" have huge potential to reduce traffic collisions.13 These are communications technologies that connect vehicles, infrastructure (roadways, traffic signals) and people, and alert drivers or autonomous vehicles to the presence of pedestrians and bicyclists, potentially averting collisions.
The transportation system is undergoing rapid change in which shared, electric, and autonomous passenger vehicles are expected to replace individually owned gasoline powered cars. As the internet increasingly becomes a significant retail medium, goods delivery by vehicle, robots, and drones are also expected to become prevalent. The implications for active travel, safety, and health are not known. Early studies suggest that active travel is decreased by these technologies as currently deployed.14 ITHIM is a tool that can support health impact assessments of these new technologies and business models.
The threat of violent crime and theft of personal property, including bicycles, is a deterrent to active travel. Streets strewn with litter, trash, and graffiti may pose an unwelcoming environment. Some of these drawbacks can be countered with a strategy of crime prevention through environmental design, or CPTED.
References
7. Hussain Q, Feng H, Grzebieta R, Brijs T, Olivier J. Impact speed and probability of pedestrian fatality: A systematic review and meta-analysis. Transportation Research Board. 2019;in press.
11. Paradies Y, Ben J, Denson N, Elias A, Priest N, Pieterse A, et al. Racism as a determinant of health: A systematic review and meta-analysis. PLoS ONE 2015;10(9): e0138511.
12. Byrne JP, Mann NC, Dai M, Mason S, Karanicolas P, Rizoli S, et al. Association between emergency medical service response time and motor vehicle crash mortality in the United States. JAMA Surg. 2019.
Decrease Air Pollution, Greenhouse Gases, and VMT
Reducing greenhouse gas emissions that contribute to climate change is a legislative priority for many states, regions, cities, and tribal nations throughout the United States. The 4th National Climate Assessment identified more than 450 U.S. cities employing one or more mitigation strategies, including 110 cities with specific emission targets. In 45 of 50 states, the transportation sector had mitigation strategies that promoted active transportation, low carbon fuels, public transit, electrification of vehicles, and land use that reduces vehicle miles traveled. 1-3
There are different health implications of the different strategies. While reengineering fuels and vehicles is essential, replacing short car trips by walking, biking and transit offers potentially more health co-benefits. How cities, states, and the nation approach this challenge will have major public health implications.Policy
The federal Clean Air Act is the basic framework for reducing air pollution in the United States, and, since 2011, has included the regulation of carbon dioxide and other greenhouse gases. In addition, 27 states have passed legislation with specific greenhouse gas reduction targets. Below are examples from governmental and other organizations that are developing or implementing transportation-related strategies for greenhouse gas reduction.
- Overview of the federal Clean Air Act
- States with legislatively mandated greenhouse gas reduction targets
- U.S. Cities in the C40 Megacity Network
- Transportation & Climate Initiative of the Northeast and Mid-Atlantic States
- U.S. Corporate Average Fuel Economy (CAFE) and greenhouse gas emissions standards
- State low carbon and alternative fuel standards
- State low/zero emissions vehicle policies and incentives
- California Air Resources Board 2017 Climate Change Scoping Plan
- Legislation coordinating transportation and land use planning to reduce greenhouse gas emissions
- Vehicle miles traveled as an environmental impact metric for transportation projects
Systems
Systems strategies for VMT reduction include the following:
- Pricing: roadway tolls, VMT fees, fuel taxes, congestion pricing to access inner cities, parking prices, pay-as-you-go insurance, freight low emissions zones; subsidies and rebates for electric vehicles
- Infill Development/land use (See also Increasing Physical Activity/Land Use)
- Transportation Demand Management Programs: carpooling, subsidized travel for van pools, preferential parking for carpools, and telecommuting programs.
Environment
- Bicycle and pedestrian infrastructure and transit investments (see Increasing Physical Activity)
- Highway Capacity: increased highway capacity generally increases or induces more car travel
- Infrastructure support for electric vehicles: charging stations.
References
Evidence
The following sections summarize the evidence for the strategies of increasing physical activity through active travel, increasing safety of active travel, and decreasing air pollution, greenhouse gases, and vehicle miles traveled (VMT). The quantity and quality of the evidence varies by policy, systems change, and environmental change (PSE). Nonetheless, there is a consensus among systematic reviews that many of the strategies achieve their goals. Although some strategies appear to have a small effect in isolation, most reviewers agree that combining strategies is likely to have a large cumulative impact. Major challenges are scaling PSE from project to state level, and ensuring PSE addresses existing health inequities.
Increase Physical Activity
Based on the review of over 90 studies through June 2014, the Community Preventive Services Task Force concluded there was sufficient evidence linking increased physical activity to built environment approaches that combine improvements to pedestrian or bicycle transportation systems with one or more land use and environmental design interventions.1 The specific features of the transportation systems and land use interventions are summarized in the following tables.
Table 1. Pedestrian and Bicycle Transportation System Interventions
| Intervention | Examples |
|---|---|
| Street pattern design and connectivity | Designs that increase street connections and create multiple route options, shorter block lengths |
| Pedestrian infrastructure | Sidewalks, trails, traffic calming, intersection design, street lighting and landscaping |
| Bicycle infrastructure | Bicycle systems, protected bicycle lanes, trails, traffic calming, intersection design, street lighting and landscaping |
| Public transit infrastructure and access | Expanded transit services, times, locations, and connections |
Table 2. Land Use and Environmental Design Interventions
| Intervention | Examples |
|---|---|
| Mixed land use | Residential, commercial, cultural, institutional, or industrial land uses that are physically and functionally integrated to provide a complementary or balanced mix of restaurants, office buildings, housing, and shop |
| Increased residential density | Smart growth communities and new urbanist designs, relaxed planning restrictions in appropriate locations to reduce sprawl, sustainable compact cities and communities with affordable housing |
| Proximity to community or neighborhood destinations | Community destinations such as stores, health facilities, banks, and social clubs that are accessible and close to each other |
| Parks and recreational facility access | Public parks, public recreational facilities, private fitness facilities |
The evidence also indicates that these interventions contribute to a meaningful increase in both transport-related and recreational physical activity, including an increase in the percentage of the adults who engage in 150 or more weekly minutes of moderate or vigorous physical activity. Additional reviews provide evidence for specific interventions that increase bicycling.2
Increase Safety
There is an abundance of studies that relate transportation infrastructure to the safety of active travel. For a given countermeasure, the quality of studies varies widely and the evidence may not always be consistent across studies. Nonetheless, several themes emerge from assessments of the scientific literature. Reducing speed lowers the risk of a crash as well as its severity. Separating pedestrians from motor vehicles in time and space reduces crash risks. Increasing the visibility of pedestrians and cyclists, including night time street lighting, also reduces crash risks.3,4 The range of percent reduction in crash rates, injuries, or conflicts in specific studies for interventions can be found at the Crash Modification Factors Clearinghouse.
Table 3. Infrastructure for Pedestrian and Bicyclist Safety
| Topic/Examples |
|---|
| Manage Vehicle Speeds |
| Roundabouts/traffic circles |
| Traffic calming (curb extensions, chicanes, speed bumps/humps) |
| Multi-way stops |
| Separate Pedestrians/Bicyclists and Vehicles by Time |
| Exclusive pedestrian signal phase for crossing lights |
| Bicycle crossings, sometimes raised and with cyclist-operated traffic signals |
| Early release signal timing (leading pedestrian interval) |
| Installation of traffic signal |
| Traffic signal change interval timing |
| Pedestrian prompting devices |
| Automatic pedestrian detection for display of walk signal |
| In-pavement flashing lights |
| Separate Pedestrians/Bicyclists and Vehicles by Space |
| Pedestrian/bicycle overpasses |
| Advance stop lines |
| Pedestrian barriers/fences |
| Sidewalks |
| Refuge islands |
| Increase Visibility and Conspicuity of Pedestrians/Bicyclists |
| Increased intensity of roadway lightings |
| Installation of internally illuminated warning signs |
| Bus stop relocation |
| Diagonal parking |
| Crosswalk markings |
Safety Education and Media Campaigns
Despite the abundance of community-based education programs for pedestrians and cyclists, few have been systematically evaluated for effectiveness using rigorous research methods. Programs vary widely in target audience (children, adults), content, duration, format (classroom, on-line, field trips). Education programs include both community media campaigns as well as individual instruction. Most evaluations have focused on school-aged children. Systematic reviews indicate that education programs increase knowledge and safety behaviors.5,6 However, the degree to which these translate into decreased injury rates is not well documented.
Enforcement
Speed limits and their enforcement have been extensively studied.7 The lowering of national highway speed limits to 55 miles per hour --- an effort to conserve fuel in response to a 1973 international oil crisis --- is credited with saving 3,000 to 5,000 of lives annually. This health benefit has erodedover time as federal law granted states the authority to raise highway speeds. Lowering posted speeds limit on residential roads and arterials has been less studied, but evidence indicates that average speeds decrease but still exceed the maximum posted speed.
Of the several enforcement strategies, automated speed enforcement (ASE) has undergone multiple evaluations. This includes the reduction of red-light running at intersections as well as speed cameras, or photo-radar, which records both the speed and image of a vehicle as it exceeds a speed threshold. Automated red-light running benefits include reduced crashes overall but may increase rear end collisions. Injury crashes are reduced by speed cameras as much as 25% when they are deployed at conspicuous, fixed, camera sites. Area-wide reductions in crashes have been found in covert, mobile enforcement programs using speed radar.7
Traffic enforcement is most effective when it is highly visible and publicized. Enforcement also covers pedestrian and bicyclist travel behaviors. For pedestrian these include walking outside crosswalks or against signals. For cyclists they include speeding or failure to yield at intersections, sidewalk riding, or wrong way riding. Pedestrians and cyclists may travel while impaired or distracted by electronic devices. A limited number of studies show enforcement coupled with publicity campaigns reduces pedestrian or bicyclist traffic safety violations.7
Decrease Air Pollution, Greenhouse Gases, and Vehicle Miles Traveled (VMT)
Since the 1970s, the United States and 13 states following California rules regulate air pollution from motor vehicles and employ a suite of strategies that are credited with lowering of vehicle emissions over time despite a large increase in the U.S. population. The strategies include:
- Engineering of combustion engines, transportation fuels and fueling, exhaust systems, pollution control devices and sensors
- Increasingly stringent standards for new vehicles that set maximum emission rates per mile of organic gases, carbon monoxide, oxides of nitrogen, formaldehyde, and diesel particulates
- Requirements that vehicle manufactures increase the mix of cleaner conventional vehicles and increase the percentage of zero-emissions vehicles (to reduce carbon dioxide pollution)
- Periodic "smog check" inspections of the vehicle fleet timed with motor vehicle registration
- Older vehicle retirement incentives "Cash for Clunkers" for low-income residents.
Several strategies for VMT reduction are supported by evidence. A recent analysis8 summarized the size of the effects and strength of evidence for the different strategies.
Table 4. VMT Reduction Strategies, Effect Size, Strength of Evidence, and Potential Implementation
| Strategy | Effect on VMT | Potential for Statewide Implementation and Adoption |
|---|---|---|
| Pricing | Strong effect/ Solid evidence | Can be applied state-wide (fuel taxes, VMT fees) in targeted areas (link pricing, cordon pricing, parking pricing). Most effective where individuals have good alternatives to driving. Strategies have equity implications. Generates revenues that be invested in transportation system. |
| Land Use/Infill Development | Moderate effect/ Solid evidence | Most applicable in metro areas. Will affect populations living and working in infill areas. May depend on changes in local land use policy. May require financial incentives. Land use changes VMT effects accrue over the long term. |
| Transportation Investments | ||
| Bicycle/Pedestrian | Small effect/ Moderate evidence | Most applicable in metro areas. Will affect populations living and working where investments are made. May depend on changes in local investments. May require financial incentives. May require package of strategies. Many co-benefits. |
| Transit | Small effect/ Moderate evidence | Most applicable in metro areas. Will affect populations living and working where investments are made. May depend on changes in transit agency action. May require financial incentives. May require package of strategies. Many co-benefits. |
| Highways | Strong induced VMT effect/Solid evidence | New capacity that reduces travel times leads to growth. Effect is greatest in congested areas. Operational improvements that reduce travel can also induce VMT. | Transportation Demand Management | Moderate effect/ Solid evidence | Most applicable in metro areas. Generally implemented by large employers in response to state or local requirements or financial incentives. Some applications appropriate for rural areas. |
References
2. Pucher J, Dill J, Handy S. Infrastructure, programs, and policies to increase bicycling: An international review. Prev Med. 2010;50:S106-S125.
3. Retting R, Ferguson S, McCartt A. A review of evidence-based traffic engineering measures designed to reduce pedestrian-motor vehicle crashes. Am J Public Health. 2003;93:456-1463.
4. Reynolds C, Harris M, Teschke K, Cripton P, Winters M. The impact of transportation infrastructure on bicycling injuries and crashes: a review of the literature. Env Health. 2009;8(47).
6. Duperrex O, Bunn F, Roberts I. Safety education of pedestrians for injury prevention: a systematic review of randomised controlled trials. BMJ. 2002;324:1-5.
Data & Resources
What Are the Data Sources for ITHIM USA?
Seven principal data sources are used to calibrate ITHIM USA and develop the Baseline 2015 scenario:
The National Household Travel Survey, conducted by the Federal Highway Administration, sampled approximately 130,000 of 118 million U.S. Households. A travel diary was used to record trips taken by each household member on a specific day between April 2016 to April 2017. The mode of travel (walk, bicycle, car, bus, rail, motorcycle) and the purpose of the trips (work, school, recreation/entertainment) were also recorded. From this information, ITHIM USA was able to calculate the daily distances and times of active travel used in the Baseline 2015 scenario. NHTS provided information on short car trips (< 5 miles) , which was used to construct the Short Trip scenario in which half of trips <1 miles were walked and trips 1 to 5 miles were bicycled.
The National Health and Nutrition Examination Survey, sponsored by the National Center for Health Statistics at the Centers for Disease Control and Prevention, is an ongoing survey of the non-institutionalized, civilian U.S. population. In 2015 and 2016, individuals in 9,991 households were asked about their leisure physical activity and walking for transportation and for leisure. ITHIM USA used this information to calculate the duration and intensity of leisure time physical activity.
The U.S. Census Bureau uses statistical techniques to predict the future population of the United States(broken down by age and gender) from 2015 to 2050. These data were used to account for population increase and aging of the population in the prediction of the burden of disease between 2015 and 2050. Population increases were also used to estimate total car carbon emissions based on emission rates per mile and per capita car travel distances.
The Global Burden of Disease (GBD) is estimated by the Institute for Health Metrics and Evaluation in a collaboration with the World Health Organization. This is the source of information for the prinicpal health outcomes which include deaths, years of life lost (yll) , years living with disability (yld), and diability adjusted life years (daly)
The Fatality Analysis Reporting System is an automated database of fatal traffic collisions on public roads reported by law enforcement agencies. ITHIM tabulated fatal injuries (in 2016) and collision descriptions to determine travel modes and occurrence on local roads, arterials, and highways. The Crash Report Sampling System (CRSS) is a national probability sample of fatal and non-fatal traffiic collisions. Non-fatal serious traffic injuries in 2016 were used in conjunction with the Global Burden of Disease to estimate disability adjusted life years due to road traffic injuries
MOVES14a (Motor Vehicle Emission Simulator) is a mobile source emissions model. The US. Environmental Protection Agency created a down-loadable application for desktop computers. The outputs are broken down by amount and type of emission (PM2.5, oxides of nitrogen, brake and tire, sulphur dioxide, CO2), type of vehicle and fuel type (gas, diesel, electric), and year with projections from 2000 to 2050. ITHIM USA used these data to project ambient PM2.5 levels and CO2 emissions based on car miles traveled in different scenarios.
Several other data sources were used to estimate inputs such as annual truck miles traveled and miles traveled by motorized vehicles by facility (roadway) type and bus occupancy . These data were publically available from agency websites as data files or statistical tables. Mortality data from CDC WONDER were used to calculate the proportion of colon cancers in the colo-rectal cancer diagnostic category.
Where Can I Download Data Files for ITHIM USA?
ITHIM USA has 24 separate input data files (processed from the above data sources). You can download these files and a data dictionary that lists the file names, the variables in each file, and the definitions of the variables and their coding levels.
Where Can I Get Information on the Design of Healthy Transportation and Communities?
In addition to the references at the end of each Decision Support page, we highlight often-cited resource guides and best practices.
Transportation Design
- National Association of City Transportation Officials (NACTO)
- Federal Highway Administration - Proven Safety Countermeasures
- LA Metro - Transit Supportive Planning Toolkit - Case studies
Neighborhood Design
The U.S. Green Building Council's LEED® green building program, particularly LEED for Neighborhood Development, provides information and guidance for encouraging development projects to include walkable streets, compact and infill development, connected and efficient multimodal streets, mixed use neighborhoods with diverse housing types and levels of affordability, housing in proximity of jobs, reduced parking footprint, transit and cycling facilities, access to public spaces and recreation facilities, local food production, tree-lined and shaded streets, access to neighborhood schools, and community involvement in design and planning decisions.
Federal and State Programs
- U.S. Environmental Protection Agency
- U.S. Department of Transportation
- Transportation and Health Tool
- Bicycle and Pedestrian Program
- Pedestrian and Bicycle Safety
- Bicycles & Transit
- Centers for Disease Control and Prevention
- Physical Activity
- State Physical Activity and Nutrition Programs
- Motor Vehicle, Pedestrian, and Bicycle Safety
- Improving Health through Transportation Policy
- State Programs
Community-Based Organizations
Clearinghouses
Equity Data and Strategies
- Equity Strategies for Practitioners - VisionZero.org
- The Biking & Walking Benchmarking Report Website: An Online Tool to Support Health Equity
- At the Intersection of Active Transportation and Equity - National Safe Routes to School Partnership
- Elevating Health & Equity into the Sustainable Communities Strategy (SCS) Process
- 2017 Regional Transportation Plan (RTP) Guidelines for Metropolitan Planning Organizations (MPOs) Appendix K: Public Health / Health Equity
Climate Change & Health
Where Can I Find Indicator Projects with Transportation and Health Data?
What Other Transportation and Health Modeling Tools are Available or Being Developed?
User Support
Video Tutorials


Uploading Data


R & Shiny Code
Developers
- ITHIM USA R/Shiny Application (ZIP)
- R/Shiny Tool Documentation (PDF)
- R Project for Statistical Computing
- RStudio
R Interfaces for Travel Demand/Activity-Based Models
Developers
- ITHIM USA R/Shiny Application (ZIP)
- R/Shiny Tool Documentation (PDF)
- R Project for Statistical Computing
- RStudio
